

PRESS RELEASE
Year-on-Year Analysis
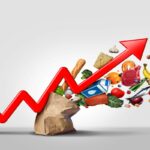
The All Items Index for the period ending April 2024 rose 6.0%.
The April increase was largely impacted by increases in the indexes for Miscellaneous Goods and Services (+24.6), Communication (+17.4%) and Food and Non-Alcoholic Beverages (+6.1%).
All three groups accounted for 80.5% of the overall All Item Index increase.
The increase in the Miscellaneous Goods and Services Index was driven by increases in the sub-categories: Personal Effects (+69.7%), Social Protection (+67.6%), Personal Care (+29.3%) and Insurance (+16.6%).
The index for Communication increased by 17.4% and was impacted by increases in the indexes for Telephone and Telefax Equipment (+43.9%) and Telephone and Telefax Services (+4.5%).
The Food and Non-Alcoholic Beverages Index increased 6.1% driven by the 5.6% increase in the Food Index.
Seven of the nine food sub-categories rose over the twelve months led by the Vegetables Index accounting for 37.9% of Food inflation.
The Bread and Cereals Index increased 10.1% and contributed 30.0% to Food inflation. The indexes for Meat and Meat Products, Food Products N.E.C, and Fruit combined contributed 20.4% of the Food Index increase.
The All Items Index Less Food and Energy or Core Inflation rose 6.5%, driven by increases in the indexes for Miscellaneous Goods and Services (+24.6%), Communication (+ 17.4%), Housing Water, Electricity, Gas and Other Fuels (3.2%) Restaurants and Hotels (+12.9%), and Alcoholic Beverages (+6.5%).
Month-to-Month Price Changes
These indices are based on expenditure patterns in 2006.
The All Items (or overall) index, with all of its twelve (12) component indices, is published each month.

For a detailed account of the methodology used in calculating the CPI, please call the Statistics Division.
The Monthly Consumer Price Index increased in April by 5.1%.
The increase in the April Month-on-Month CPI was attributed largely to an increase in the index for Transport of 20.0%.
The Transport index was affected by a 63.4% increase in the index for Passenger Transport by Air.
Price increases were recorded for destinations to St. Maarten, Barbados, Miami, New York, and the United Kingdom.
The Food and Non-Alcoholic Beverages increased by 1.6% with the index for Food increasing by 1.6% over the month. The food category posted mixed results with four of nine subcategories posting increases over the one month.
The index for Vegetable and Bread and Cereals increased by 5.3%
and 4.7% respectively.
Notable decreases were Fish and Seafood (-3.8%) and Oil and Fats (-1.7%).
The index for All Items Less Food and Energy rose by 6.2% in April. The increase was influenced by the increases in the indexes for Transport Services (+63.4), Miscellaneous Goods and Services +15.4%), Restaurants and Hotels (+4.6%), and Recreation and Culture (+3.1%).
Methodology
What is the consumer price index (CPI) measuring and how is it done?
The All Items Consumer Price Index (CPI) is the main measure of what is commonly called inflation, or headline inflation.
It measures the change in prices, on average, from month to month, and from year to year of the goods and services bought by most households.
Prices are collected monthly and quarterly from supermarkets and other suppliers of goods and services.
The pattern of household expenditure on these goods and services is derived from a regular household budget (or expenditure) survey (HBS).
The prices and spending patterns (known as weights)
are then combined to calculate the price indices for groups of goods and services and for the All Items index.


0 Comments